
Learn about the stages of qualitative coding in this post with Dr. Philip Adu, Founder and Methodology Expert at the Center for Research Methods Consulting, LLC.
What is Qualitative Coding?
Coding in qualitative data is the process of labeling your data to help identify key themes and connections between the data.
Coding qualitative data is a common challenge for many researchers as it can be a time-consuming process. Qualitative research often involves large, text-heavy data sets from data types such as open-ended interview questions and survey transcripts. Later in this article, we’ll discuss how using qualitative data analysis software for qualitative coding can be a solution for this challenge.
How Does Qualitative Coding Work?
Think about analyzing interview transcripts with open-ended questions: capturing significant information from the data and putting them into ‘containers’, called codes (in NVivo).
When coding, it is important to label each code created, providing a brief description about each of the codes, and documenting your reflections.
You then sort the codes into ‘big containers’ called parent codes based on their content similarities and unique relationships.
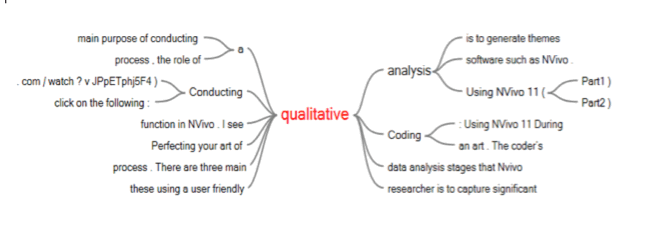
Lastly, you use the parent codes (i.e. themes) to address the research question(s). Here's an illustration of the high-level process:

Imagine doing all these using a user friendly qualitative analysis software such as NVivo. It contains features which help you to work on multiple data, run queries, code significant parts of data, add descriptions and memos (reflections) to the codes generated, create illustrations to better display your findings, and brainstorm ideas using the ‘Mind Maps’ function in NVivo.
>> Watch On-Demand Webinar: NVivo 14: Thematic Analysis Using NVivo
Three Ways to Ensure Credibility in Your Qualitative Coding Process
The coder’s findings (such as themes, models, and/or theories) don’t only represent the data but reflect his/her subjective intent and thought process, background, and experiences.
To ensure credibility, the coder needs to be transparent in the coding process. There are three main qualitative data analysis stages that NVivo could be effectively used for to maintain transparency, attain consistency of the labels or nodes created, and reach meaningful findings with visual representations.
1. Pre-coding stage (getting to know your data)
I always start the coding process with a review of all the data, to familiarize myself.
The ‘Query’ command (in NVivo) for example, is a great tool to use so as to know the kind of words participants use and how often they are used.
The ‘Word Frequency’ result could be displayed as a ‘Word Cloud’ with varied word fonts depicting the number of times the words are utilized:
In addition, I sometimes want to know how a specific word or phrase is used in a participants’ responses. So, I use the ‘Text Search’ command resulting in the creation of a ‘Word Tree’.
The ‘Word Tree’ shows words or phrases used before and after the searched word. This helps in knowing the context in which it was used:
2. Coding stage (assigning labels to the nodes)
When coding, the consistency of codes or nodes generated is crucial. It helps you to easily see the relationships between nodes and sometimes figure out underlying ideas and meanings among them.
So how do you maintain consistency of nodes?
One strategy is to select specific coding method(s) consistent with the research question to create labels for the nodes. In NVivo, video and transcript data can be labeled with “coding stripes” which indicate which section of a data is assigned a code (Saldana, 2013).
NVivo’s autocoding feature can speed up your coding process by using AI to identify text passages that match your initial coding of the unstructured data.
3. Post-Coding stage (presenting your findings)
The main purpose of conducting a qualitative analysis is to generate themes to address the research questions (Adu, 2013).
After coming up with themes, the next stage is to present the findings.
How the results are presented to your audience could impact the credibility of the results. To ensure credibility, a researcher should present each theme with its respective meaning and evidence from the data. Adding a visual representation of the themes, their relationships, and related ideas helps the audience to better understand the findings (Saldana, 2013).
The NVivo ‘Explore’ function is an excellent tool to create project maps, concept maps, charts, and cluster trees just to mention a few.
>> Watch On-Demand Webinar: Explore and Visualize Your Data Using NVivo 14 to Tell the Story
Qualitative Coding with NVivo
In conclusion, data analysis is a very intensive process, with qualitative researchers carefully and systematically reducing the data to themes to address the research question. To attain credible findings, the coder should extensively document the process and clearly explain how they arrived at the findings.
NVivo is a great qualitative analysis software which could be used to code data, document the data analysis process, and present a visual presentation of the results so as to increase credibility and save significant amounts of time.
References
Adu, P. (2013, November 22).
Qualitative analysis coding and categorizing.
Saldana, J. (2013).
The coding manual for qualitative researchers. London: Sage
ABOUT THE AUTHOR

Philip Adu
Dr. Philip Adu is the Founder and Methodology Expert at the Center for Research Methods Consulting, LLC. You can access some of his webinars at the ‘Methodology Related Presentations – TCSPP’ YouTube Channel. He completed his Doctoral degree in Education with a concentration in Learning, Instructional Design and Technology from West Virginia University (WVU). Dr. Adu recently authored a book titled, “A Step-by-Step Guide to Qualitative Data Coding” (available on routledge.com or amazon.com). You could reach Dr. Adu at @drphilipadu on Twitter.