
Dr. Philip Adu is a Methodology Expert at The Chicago School of Professional Psychology (TCSPP). In this post he explains the things to consider when presenting your research findings.
This post follows on from his previous blog post “Perfecting the art of qualitative coding” in which he took us through the stages of qualitative coding and, along the way, outlined the features he found most useful.
In my previous blog post, I presented on making good use of the innovative features of NVivo across the three main stages of qualitative analysis. Expounding on the third stage which is the ‘Post-Coding stage (Presenting your findings)’, I want to throw light on things to consider when drafting and refining your presentation. The moment you reach a milestone of successfully using NVivo 12 (Version 12.1.249; QSR International Pty Ltd, 2018) to complete the data analysis process, the reality of preparing all of this data so you can present your findings sets in (Adu, 2016). Your methodical review of the qualitative data and development of codes, categories and themes has yielded massive and interesting NVivo outputs. The outcomes include but are not limited to; codes/nodes, categories/themes, Word Clouds, Word Tree, Framework Matrices, Cluster Tree, code-case matrices, and code-attribute matrices (see Figure 1). These findings need to be carefully examined – selecting the ones that will be useful in drafting a meaningful presentation. You can watch the presentation I developed below:

Source: https://www.youtube.com/watch?v=xEyGGFtVQFw
Note, not all of this information (i.e. the outcomes) needs to be presented to your audience (see Adu, 2019). Other questions that may arise as you develop your presentation include; what kind of results should you present? How do you engage with your audience when presenting your findings? How would you help your audience to understand and believe your findings?
In this post, I will discuss the three pertinent components a good presentation of qualitative findings should have. They are; background information, data analysis process and main findings.
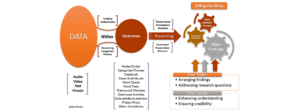
Figure 1. Presentation of findings
Presenting background information
Participants’ past and current situations influence the information they provide to you. Due to this, there is the need to provide readers a summary of who participants are and any background information which may help them to put the findings into the proper context. Also, as a researcher analyzing qualitative data, there is the likelihood of your own background impacting the data analysis process. In the same way, you need to let readers know who you are, what your background is and how you ‘bracketed’ them from not having an effect on the findings (Adu, 2019).
Presenting the data analysis process
Qualitative analysis doesn’t only involve engaging in subjective development of codes and categories, but also promoting transparency in the coding and categorization process (Greckhamer & Cilesiz, 2014). Due to this, you are expected to describe the main and detailed steps you took to analyze your data to arrive at your findings and their respective outcomes. Addressing the following questions would be great:
- What coding strategy did you use?
- What kinds of codes did you assign to relevant excerpts of the data?
- What are the examples of codes you generated?
- What categorization technique did you use?
- How did you develop categories/themes out of the codes?
Your audience’s aim is not only consuming what you found but also learning more about how you came up with the results.
Presenting main findings
When it comes to the presentation of findings, there are two main structures you could choose from. You could present them based on the themes generated or based on the cases (participants or groups of participants) you have. The decision to either structure depends on the kind of research question(s) or the research purpose you have. For a detailed explanation of the types of presentation formats and how to select an appropriate structure, see Chapter 13 of the book, “A Step-by-Step Guide to Qualitative Data Coding”.
Considering your roles and goals
As you plan on how to communicate the above components, make sure you accomplish your goals and carry out your role as a communicator of qualitative data analysis outcomes (See Figure 1). Your roles are; to thoughtfully arrange the data analysis outcomes and to adequately address your research questions.
Liken the presentation of your findings to sharing a puzzle which has been solved. Your goal is to prevent a situation where the burden is put on the audience to piece together the puzzle of findings. In other words, you are expected to present the findings in a meaningful way that would enhance the audience’s understanding of the data analysis outcomes (Adu, 2016 & 2019). By so doing, they are more likely to trust what you found.
Let’s summarize the action items:
- Out of a pool of qualitative analysis outcomes, select the ones that would allow you to address your research questions and meaningfully communicate your findings.
- Decide on how you want to structure the presentation of the findings.
- Irrespective of the presentation format you choose, make sure you include background information, the data analysis process and main findings in your presentation.
- Make sure you are ‘narrating’ participants’ stories or what you found – making the numeric outputs include the tables and charts generated play a supporting role when presenting the main findings.
References
Adu, P. (2016). Presenting Qualitative Findings Using NVivo Output to Tell the Story. [PowerPoint slides]. SlideShare. Retrieved from https://www.slideshare.net/kontorphilip/presenting-qualitative-findings-using-nvivo-output-to-tell-the-story
QSR International Pty Ltd. (2018). NVivo 12. Version 12.1.249 [Computer software]. Retrieved from https://qsrinternational.com/nvivo-qualitative-data-analysis-software
Adu, P. (2019). A Step-by-Step Guide to Qualitative Data Coding. Oxford: Routledge
Greckhamer, T., & Cilesiz, S. (2014). Rigor, Transparency, Evidence, and Representation in Discourse Analysis: Challenges and Recommendations. International Journal of Qualitative Methods, 13(1), 422-443. doi:10.1177/160940691401300123
ABOUT THE AUTHOR

Philip Adu
Dr. Philip Adu is a Methodology Expert at The Chicago School of Professional Psychology (TCSPP). His role is to provide support to dissertating students in TCSPP addressing their methodology related concerns. You could access some of his webinars at the ‘Methodology Related Presentations – TCSPP’ YouTube Channel. He completed his Doctoral degree in Education with a concentration in Learning, Instructional Design and Technology from West Virginia University (WVU). Dr. Adu recently authored a book titled, “A Step-by-Step Guide to Qualitative Data Coding” (available on routledge.com or amazon.com). You could reach Dr. Adu at padu@thechicagoschool.edu and @drphilipadu on twitter.